How PPL Company uses 3dverse to anchor Hypervision—unifying factory operations, SAP data, and incident management in a browser-native 3D twin.
By replacing fragmented dashboards with a browser-native 3D digital twin that connects live production, orders, and incidents in one navigable environment.
Sector
Manufacturing
Country
Canada
Use case
Manufacturing 5.0
6
factory zones — unified in one 3D environment
Real-Time
Connection to all systems (no duplicates)
0
Hardware requirements or installs
PPL Company Inc. operates the Tokyo Phone Factory — a high-throughput consumer electronics facility producing thousands of units daily across fully automated, semi-automated, and human-assisted production lines.
Operational complexity was growing faster than existing monitoring tools could handle. Production disruptions cascaded silently across systems. Shop-floor data lived in siloed dashboards. Remote teams had no visual context when incidents occurred. Leadership needed something no traditional 2D MES or SCADA could provide: a living, navigable model of the entire factory in real time.
PPL turned to 3dverse to build Hypervision — a web-based, real-time 3D Digital Twin that unifies the factory floor, manufacturing operations, and enterprise systems without replacing existing infrastructure.
Instead of acting as another heavy, disconnected data aggregator, 3dverse provides the foundational, real-time 3D layer. It serves as visual canvas upon which all operational use cases are built. By connecting fragmented shop-floor data, enterprise IT systems, and industrial logic directly onto this spatial layer, PPL transforms raw numbers into a navigable, living model of their entire facility.
The Problem: Three Challenges No Dashboard Could Solve
01 — Invisible Operational Impact When a machine went down, the real cost wasn't the machine — it was understanding the ripple effect across active manufacturing orders, scheduled deliveries, and allocated resources. This assessment took hours and required multiple system logins.
02 — Fragmented Operational Data SAP managed orders. MES tracked production. PLC monitored machines. Each system spoke a different language. There was no single view that joined enterprise data with real-time floor status in a spatial context operators could actually navigate.
03 — Remote Investigation Blind Spots Engineering leads, remote operations managers, and quality teams couldn't effectively investigate incidents without being on-site. Static reports and 2D schematics failed to communicate the spatial context needed to evaluate production impact or coordinate response.
The Solution: What Hypervision Delivers
01 — Full-Factory 3D Model, Streamed Live
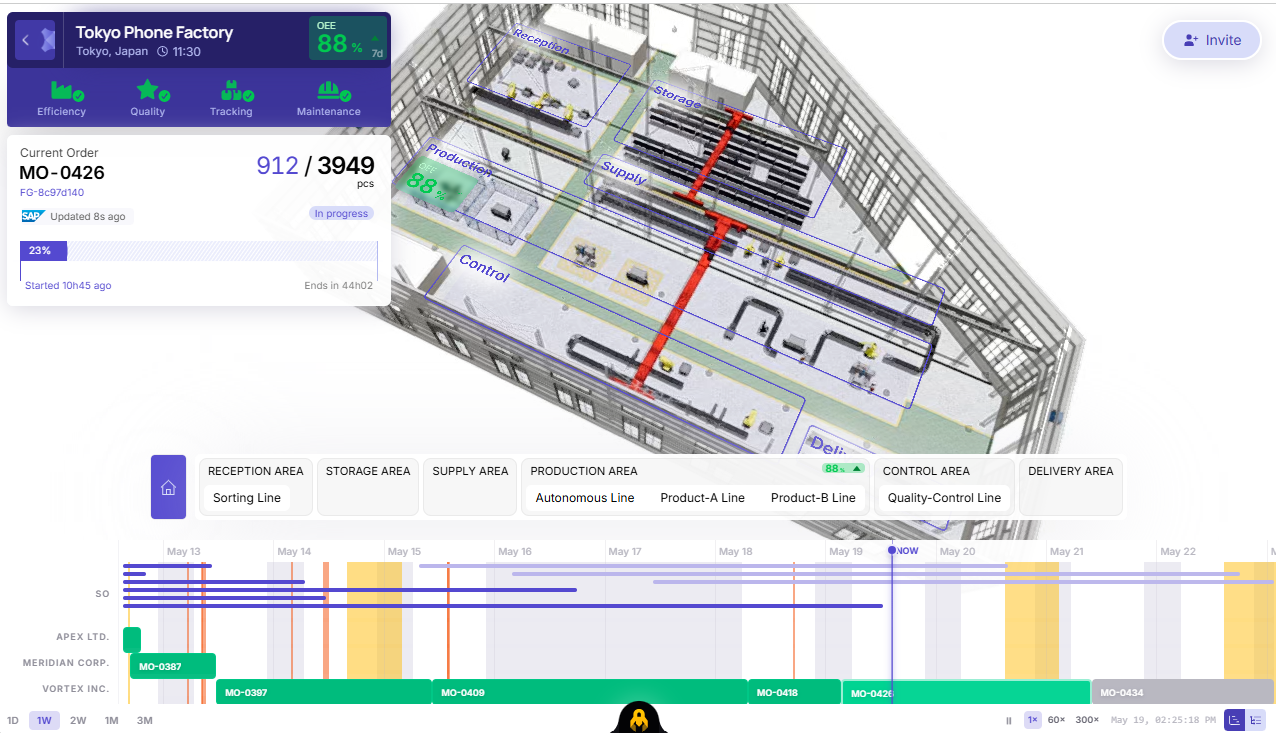
The entire Tokyo Phone Factory is rendered in 3D within the browser — no plugin, no download. Users navigate freely between six discrete production zones: Reception, Storage, Supply, Production, Control, and Delivery. The view transitions seamlessly from an overhead facility overview to an immersive first-person floor walkthrough.
Browser-native rendering via 3dverse cloud streaming — runs on standard enterprise hardware
Six navigable zones, each with dedicated sub-lines
Multiplayer-ready — invite colleagues into the same live 3D session for collaborative review
02 — Real-Time SAP & MES Synchronization
Every object in the 3D world is bound to live data. Manufacturing orders from SAP display their current piece count, completion percentage, customer reference, and time-to-deadline directly in the 3D view. Machine OEE, quality rates, and active operations update continuously — surfaced exactly where they're relevant, on the machine itself.
OEE displayed per zone and per machine, with live trend indicators
Active manufacturing orders (e.g. MO-0396: 1,878 / 3,074 pcs) linked to SAP references
Data refresh cycle in real-times from source systems to 3D view
Quality split visible per machine: Valid units vs. Rejected units per shift
03 — Zone-by-Zone Operational Navigation
A persistent navigation bar maps the factory's production flow — from Sorting Line in Reception through Autonomous, Product-A, and Product-B lines in Production to Quality Control and Delivery. Operators click any zone to instantly move the camera to that area, with all associated machines, workers, and KPIs foregrounded in the 3D view.
Zones: Reception · Storage · Supply · Production · Control · Delivery Sub-lines: Autonomous Line · Product-A Line · Product-B Line · Quality-Control Line
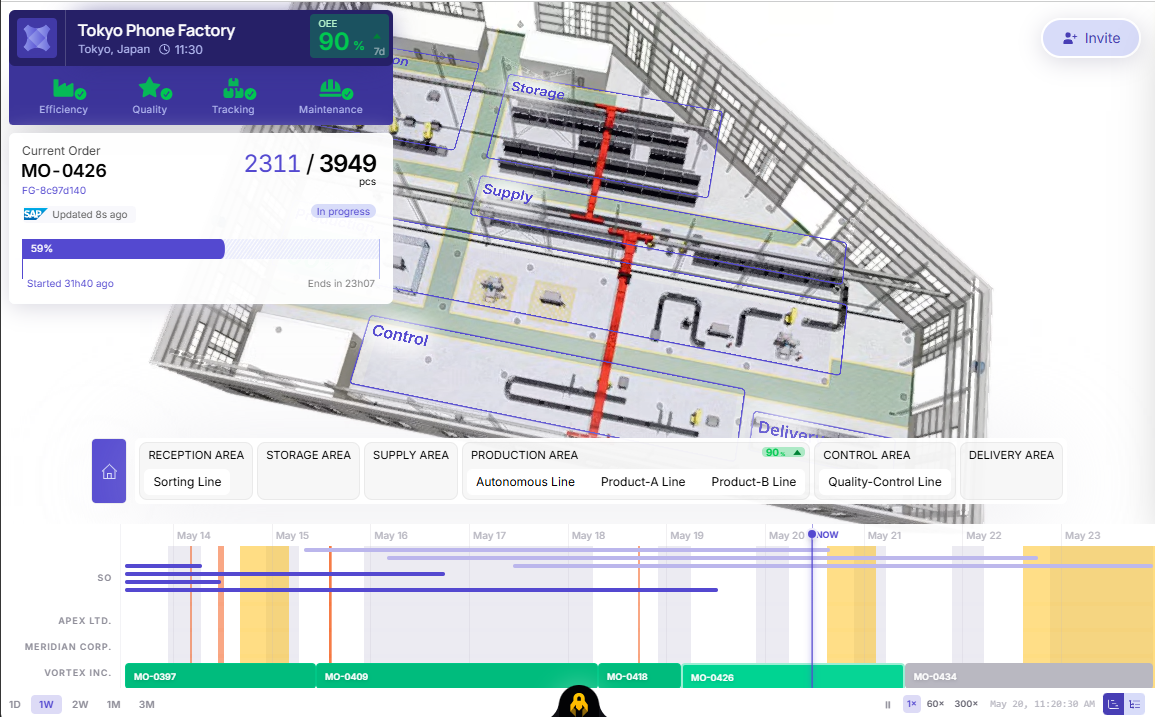
04 — Historical Playback & Gantt Timeline
A full-width Gantt chart renders every manufacturing order across all customers — APEX LTD., MERIDIAN CORP., VORTEX INC. — over a rolling time window. Users scrub through 1-day to 3-month ranges and step the entire 3D scene backward or forward in time, reconstructing the exact factory state at any past moment for incident review or planning.
Configurable playback speeds
Multi-customer order visibility on a single unified timeline
Incident timestamp anchoring — jump to a past alarm's exact moment in the 3D scene
Range filters: 1D, 1W, 2W, 1M, 3M
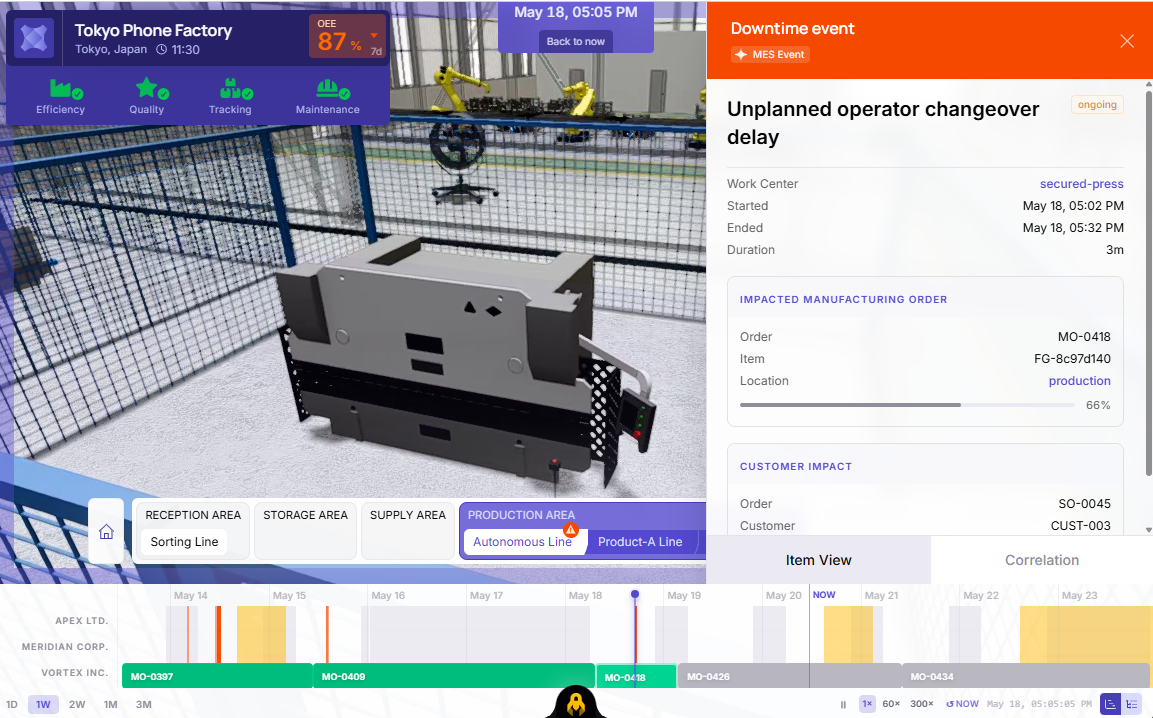
05 — In-Context Downtime Investigation
When a downtime event occurs — a tooling failure, coolant leak, or quality spike — Hypervision surfaces it directly on the affected machine in the 3D view. A side panel opens showing linked Sales Orders, Manufacturing Orders, Allocations, and active Operations, giving investigators the full blast radius of any incident without leaving the 3D environment.
Example incidents captured in the demo:
TOOLING_FAILURE (ongoing) — Tool breakage on Yantra Design CNC Drilling; OEE dropped to 77%, 34 units rejected
Coolant Leak — Flagged on Autonomous Line; "Take action" prompt surfaced as a 3D overlay
A Correlation tab surfaces related events, helping teams distinguish isolated failures from systemic patterns before dispatching resources
Interface Architecture
Factory Header Panel A persistent header shows facility name, local time, and an OEE score with trend indicator. Four mode tabs — Efficiency, Quality, Tracking, Maintenance — switch the 3D environment's data layer overlay. The Current Order widget below binds the live SAP order to the visible scene, showing piece count, SAP reference, start time, and projected end.
3D Scene — Floating Labels Machines carry floating contextual labels (Arm-Sorting, Assisted-Drilling, Secured-Press) visible at relevant camera distances. Clicking any label opens the full machine detail card. Worker avatars, AGVs, and robotic arms are represented as animated entities, giving remote viewers immediate spatial awareness of what is active on the floor.
Machine Detail Card Selecting a machine opens an overlay showing: OEE percentage with trend spark, linked manufacturing order, current operation name and progress, piece count split between Valid and Rejected, and quality percentage. This single card replaces what previously required navigating three separate systems.
Incident Side Panel When a downtime event fires, the right panel expands with a full incident context tree: MES event classification, linked Sales Orders with customer name and status, affected Manufacturing Orders with progress bars, material Allocations, and all active Operations with completion percentages.
The 3D Advantage: Moving Beyond Flat Dashboards
Traditional 2D dashboards show you what is failing, but they completely miss where and why it matters to the rest of the floor. By anchoring PPL's enterprise systems onto a 3dverse real-time 3D layer, data becomes spatial:
Instant Spatial Awareness: Remote teams don't just read an error code; they instantly see the physical asset, its surrounding dependencies, and nearby logistics assets (like AGVs and workers) in a single browser view.
Visualized Blast Radius: Instead of cross-referencing multiple tabs to guess how a machine failure ripples through the facility, operators can visually trace the operational bottleneck across production zones.
True "Time-Travel" Auditing: Merging a chronological Gantt timeline with a 3D space allows teams to physically step back into a past factory state, turning flat, complicated error logs into an intuitive, visual replay of the incident.